
Key Takeaways
The increase in inflation, due to fiscal and monetary support following COVID-19 lockdowns, has prompted the Federal Reserve to hike interest rates, a trend expected to continue to year-end
In the current inflationary environment, income-oriented equities, specifically those with consistent dividends, may offer more protection and potentially help mitigate risks associated with rising rates and volatile markets
The quality-first, forward-looking approach to dividend investing adopted by GQG Partners could offer a compelling solution for investors seeking sustainable income and potential for future dividend growth amidst inflationary trends
An unintended consequence of the fiscal and monetary support unleashed around the world by governments and central banks in the wake of the COVID-19 lockdowns was an increase in inflation. The Federal Reserve was initially optimistic that the pick up in inflation would be transitory. Inflation accelerated instead. The Fed responded earlier this year with a series of interest rate hikes, a tightening cycle that is expected to continue at least into year-end.
In the current inflationary environment, characterized by rising rates and volatile capital markets, income-oriented equities may serve as a ballast to navigate stormy seas. At GQG Partners, we have long viewed dividend income as an important source of total return in an equity portfolio. We believe that our quality-first, forward-looking approach to dividend investing is worth revisiting.
AND YOU MAY ASK YOURSELF, “WELL, HOW DID I GET HERE?”
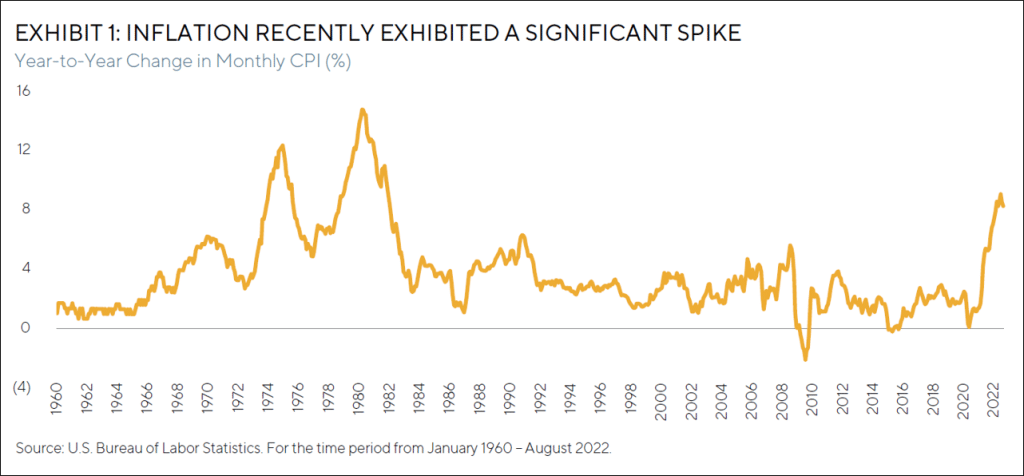
Inflation, which represents a rise in the general price level in an economy, had long been under control in the U.S., as detailed in Exhibit 1. From 1992 to 2020, the annual nominal rate of inflation, as measured by the consumer price index (CPI) published by the Bureau of Labor Statistics, averaged 2.2 per cent. During that period, the CPI peaked in 2008 at 5.6 per cent, which we believe was driven by a spike in energy prices in the summer of that year. Otherwise, there were secular trends that helped keep a lid on inflation including a globalization of the manufacturing base that constrained labor costs and the emergence of disruptive technologies that enhanced productivity in the office and on the farm.
However, in 2021, the year-to-year increase in inflation jumped from 2.6 per cent in March to 4.2 per cent in April and climbed steadily every month until it peaked at 9.1 per cent in June 2022. We believe that the combination of supply chain disruptions during the COVID-19 pandemic, historically low interest rates, and several, massive fiscal stimulus packages to support the economy were the key initial catalysts for the acceleration in domestic inflation.
In 2022, geopolitical events have also contributed to higher prices. Sanctions imposed on Russia in response to its invasion of Ukraine have resulted in higher commodity costs, particularly crude oil, as trade relations were impacted. We believe that tension with China regarding the theft of intellectual property and its potential aggression toward Taiwan may result in a reshoring effort from U.S. manufacturers to shorten their supply chains. This reversal of the globalization trend is likely to be inflationary going forward, in our opinion, due to higher labor costs.
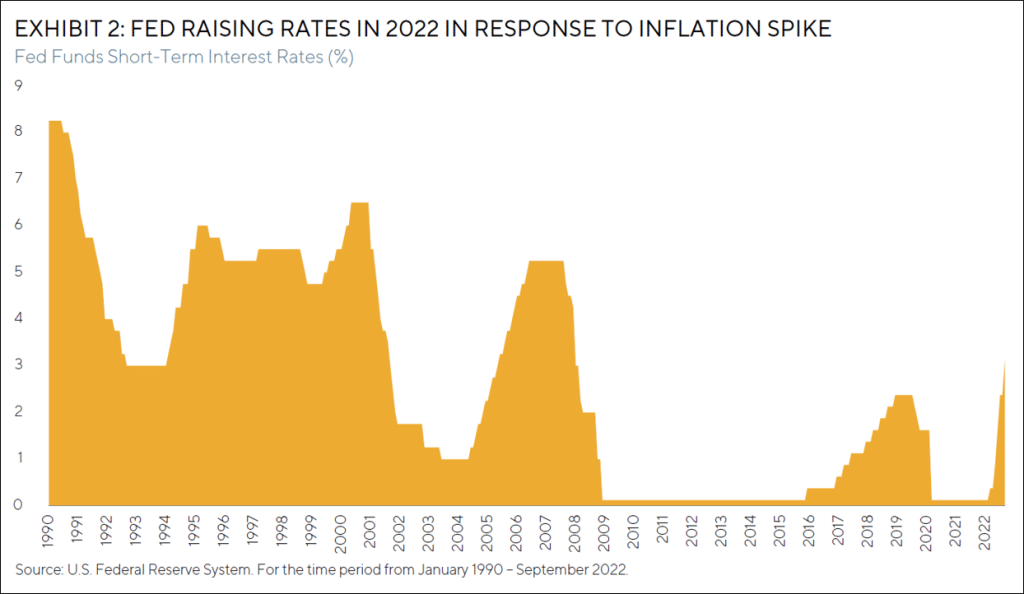
The Federal Reserve has a dual mandate of maximum employment and price stability with a stated inflation target of 2.0 per cent. While the Fed is largely succeeding on the former, as measured by an August 2022 unemployment rate of only 3.7 per cent, the central bank has work to do on the latter. Its primary tool to combat inflation is by raising the “Fed Funds” rate, which targets the interest rate at which banks can lend to each other overnight to meet their liquidity needs.
The Fed has responded to the rise in inflation by increasing the Fed Funds rate five times in 2022 from a prior target of 0-25 basis points to a current target of 300-325 basis points, as noted in Exhibit 2. In September 2022, the chairman of the Fed set expectations for additional increases in rates and holding them at a higher level until inflation approaches its 2.0 per cent target, even if unemployment rises.
However, putting the inflation genie back in the bottle is easier said than done. As presented in Exhibit 1, inflation can stay elevated for many years. During the 1973-1981 period, the annual nominal rate of inflation averaged 9.0 per cent, peaking in 1980 at 13.5 per cent.
INCOME-ORIENTED EQUITY PORTFOLIOS MAY OFFER LESS RISK IN AN INFLATIONARY ENVIRONMENT
In an inflationary environment, income-oriented equity portfolios may offer more protection than fixed income and long duration stocks (which we define below). The recent increase in interest rates to address inflation has generated year-to-date losses in most corners of the fixed income market and a rotation in leadership in the equity market from unprofitable growth stocks to less speculative names.
Inflation can negatively impact the returns from bonds in several ways. A bond’s cash flows are contractual and generally fixed. Inflation erodes the future purchasing power of those static cash flows that the bondholder expects to receive. In addition, the prices of most bonds will also decline, at least on a mark-to-market basis, as the central bank tightens monetary policy to address inflation.
A bond’s price is the present value of the cash flows that the bondholder expects to receive in the future. To calculate the bond’s present value, each cash flow is divided by (1 + an appropriate interest rate) with this term having an exponent equal to the number of years in the future when that specific cash flow is expected to be received. The “appropriate interest rate” in the denominator of the present value equation is also called the discount rate, which is expected to move in the same direction as the Fed Funds rate. Simple arithmetic indicates that as the discount rate in the denominator increases (when rates go up) while the cash flows in the numerator remain static, the present value of the cash flows (also known as the price of the bond) declines.
Investors can estimate the sensitivity of a bond’s price to changes in interest rates by calculating the bond’s duration, a metric that measures in years the bond’s weighted average cash flows. A bond that generates large coupons and matures in just a few years will have a short duration and relatively low sensitivity to changes in rates. However, if a bond pays little in interest and matures many years from now, such that the largest cash flow is well into the future, the bond will have a long duration and be very sensitive to changes in rates.
DRAWING PARALLELS – INTEREST RATE SENSITIVITY IMPACTS EQUITIES AS WELL AS BONDS
This concept of duration and interest rate sensitivity can also be applied to equities. The price of a stock, like the price of a bond, can be estimated by discounting its expected future cash flows and is subject to the same math we described earlier — when rates go up, so does the discount rate in the denominator, lowering the present value of the stock’s cash flows and therefore reducing the stock price.
Many growth companies are expected to have low or even negative cash flows for the next few years as they spend to grow their operations and gain market share. They are also unlikely to be paying a dividend. Like a long duration bond, the weighted average of future cash flows for these equities is many years away and makes the present value of those cash flows highly sensitive to changes in interest rates. When rates fell in 2020, these long duration stocks were the primary beneficiaries and outperformed the broader equity market, as presented in Exhibit 3. That trend reversed dramatically in late 2021, as the Fed signaled to investors that tighter monetary policy was likely, and continued into 2022, when the central bank started to raise rates.
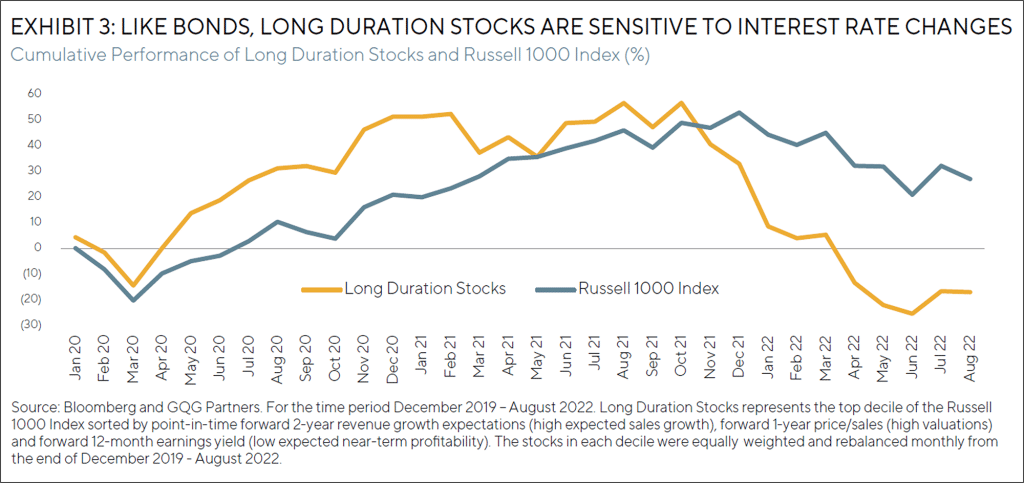
RISING RATES TYPICALLY DRIVE BOTH THE PRICES OF BONDS AND LONG DURATION STOCKS LOWER

In contrast to these long duration stocks, established companies with a track record of profitability are viewed as having shorter durations (the weighted average cash flows to shareholders are tilted toward the present rather than the future) and less interest rate sensitivity. These historically profitable businesses are also more likely to reward shareholders with consistent dividends.
DIVIDENDS ARE AN IMPORTANT POTENTIAL SOURCE OF TOTAL RETURN IN AN EQUITY PORTFOLIO
During this year’s global market volatility and uncertainty, high dividend paying companies have been outperforming broader equity market indices due in part to the contribution to total return that dividends provide. In our opinion, dividend-paying stocks are not just the object of retirees seeking an income stream. We believe that investors are attracted to these names to help weather the storm of high inflation, rising rates, and a potential slowdown in global growth.
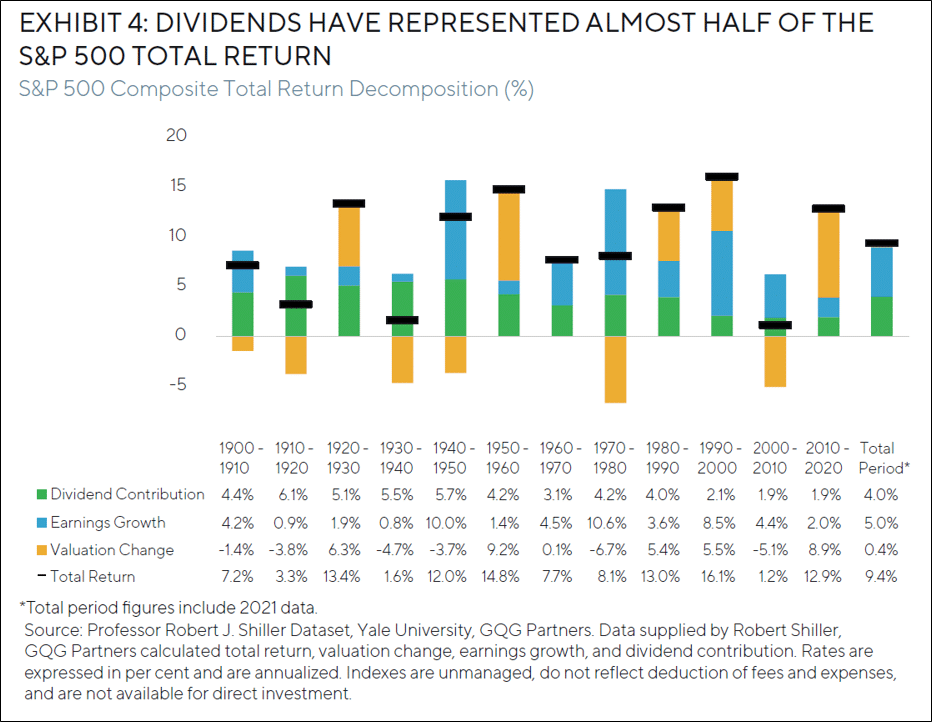
At GQG Partners, we have long viewed dividend income as an important source of total return in an equity portfolio. This perspective is supported by the strong contribution dividends have made historically to the performance of the S&P 500 Index, as detailed in Exhibit 4.
From 1900 through 2021, the index exhibited a total annualized nominal return of 9.4 per cent, primarily driven by earnings growth (5.0 per cent) and dividends (4.0 per cent). Changes in valuation, a volatile source of return with half of the 12 decade-long observations being negative, have made only a modest contribution to the index’s performance of 0.4 per cent. In other words, dividends have represented 43 per cent (4.0 / 9.4) of the S&P 500’s total return during the period.
As presented in Exhibit 4, the contribution from dividends to total return declined in absolute terms in the last three decades. During the 1950-1990 period, the dividend contribution was typically around 4 per cent but has inflected to slightly less than 2 per cent, a trend that began in the 1990s. We believe that a secular change in the composition of the S&P 500 is the primary driver of that trend.
Entering 1990, information technology was the eighth largest sector in the S&P 500 and represented only 7 per cent of the benchmark, according to S&P Global. During the 1990s, we believe that the development and proliferation of user-friendly web browsers helped catalyze a wave of dot-com entrepreneurs looking to access the capital markets to fund their businesses. Revenue growth and total addressable market size appeared to be more important investment criteria at that time than profitability or dividends. If a technology company did pay a dividend, it could be interpreted by investors that the business was lacking in ideas for additional growth and its valuation may have been lower than its peers. By the end of 1999, information technology was the largest sector in the S&P 500 at 28 per cent of the index total, more than twice the size of the second biggest sector.
As a result, the aggregate dividend yield for the S&P 500 was negatively impacted, in our opinion, as the dominant sector constituent, information technology, prioritized growth over dividends. In addition, we believe that companies in other industries observed the success that technology stocks had late in that decade and started to show similar behavior of emphasizing their ability to reinvest rather than return capital to shareholders.
Despite the dot-com bust in 2000-2002, the technology sector still ended the next decade (2000-2010) as the largest sector in the S&P 500 at 18 per cent. From the beginning of 2010 through the end of 2021, information technology remained the biggest sector in the index for all but four months (two in 2015 and two in 2016), when the healthcare sector briefly held the title as the largest sector.
In the current inflationary environment, characterized by rising rates and volatile capital markets, we believe dividends are important and income-oriented equities may serve as a port in the storm. Importantly, GQG is not constrained by the aggregate dividend yield of the index. We believe we can create and maintain a select portfolio of high quality companies that are expected to generate free cash flow and maintain, or increase, their dividends during our three-to-five-year investment horizon.
GQG APPLIES A QUALITY-FIRST APPROACH TO EQUITY INCOME INVESTING
There are multiple ways to construct income-oriented equity portfolios. Some enhanced index and/or actively-managed, dividend-oriented strategies may start their investment process with dividend yield or some other backward-looking metric. Dividend yield is a ratio of the company’s annual dividend (typically the sum of the last four quarterly payouts to common shareholders) divided by its current stock price.
However, a high dividend yield, if driven by a declining stock price in the denominator, may be more indicative of future financial distress than future dividend income. As a result, investors reaching for a high dividend yield may be taking an undue amount of risk, in our opinion.
At GQG, we focus on quality first. Evaluating the quality of a business is the initial step in our investment process and foundational to our approach across all of the portfolios we manage. Quality is a forward-looking concept for us as we attempt to establish conviction in the predictability and sustainability of a company’s future free cash flow.
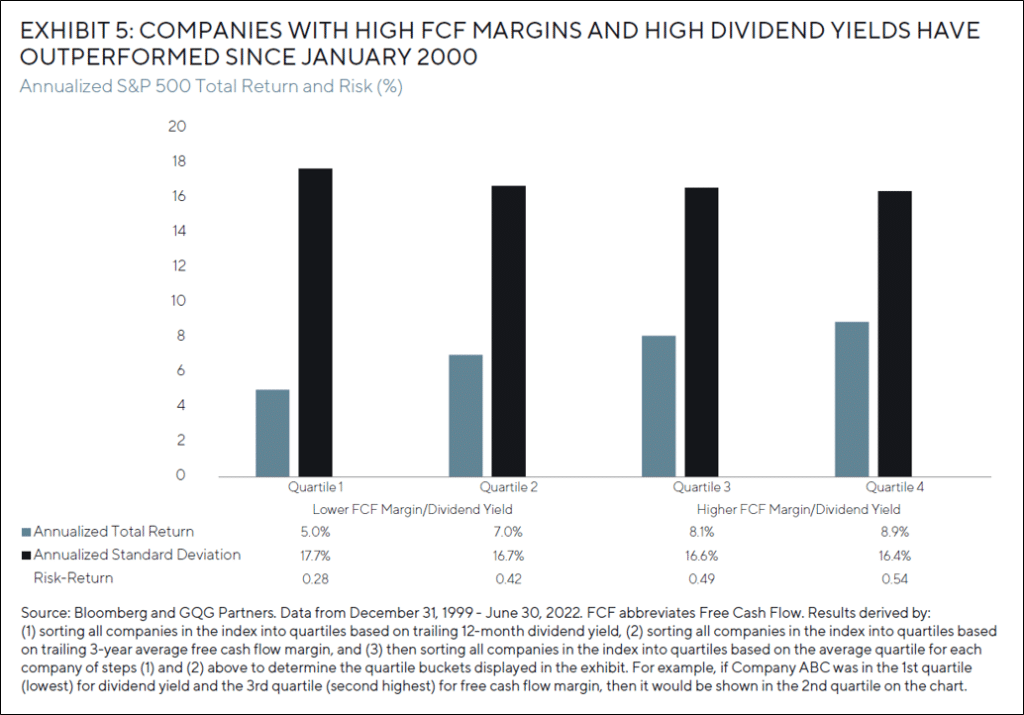
We believe there is historical evidence supporting our emphasis on quality, as presented in Exhibit 5. This analysis sorts the companies in the S&P 500 into quartiles based on a combination of the firm’s free cash flow (FCF) margin and dividend yield since the end of 1999. We believe quality companies typically have higher FCF margins than their peers, demonstrating some type of competitive moat around their businesses, which helps us gain conviction in their ability to sustain their dividends.
It is clear from the chart and table that the companies with the highest combination of FCF margin and dividend yield (Quartile 4) have outperformed those companies with the lowest combination of FCF margin and dividend yield (Quartile 1) by an average of almost 4 per cent annually while also exhibiting lower volatility, as measured by the annualized standard deviation of their total returns.
FCF is vital to the long-term success of every business and a critical requirement to maintain a company’s dividend policy. However, high FCF margins are but one input into our quality-first, forward-looking investment process. We believe other attributes of quality businesses include consistent revenue growth, stable operating margins, and solid balance sheets. Our forward-looking process relies on a diverse team of traditional and non-traditional investment professionals with skill sets that include capital structure analysis, specialized accounting research, and investigative journalism to develop a differentiated and comprehensive view of companies. We believe this research mosaic, which was designed to adapt to new data as it arrives from traditional and non-traditional sources, is a key competitive advantage at GQG.
FINAL THOUGHTS
Inflation, which had been largely under control since the beginning of 1992, has accelerated due to a combination of supply chain disruptions, historically low interest rates, multiple fiscal stimulus packages, and geopolitical events. The Fed has responded by aggressively raising short-term interest rates as well as committing to additional increases and holding rates at a higher level until inflation approaches the Fed’s target of 2.0 per cent. However, as detailed earlier, inflation can stay elevated for many years.
In an inflationary environment, income-oriented equity portfolios may offer more protection than higher duration assets like fixed income or unprofitable growth stocks. Dividends have historically been an important source of total return in an equity portfolio and income-oriented stocks can help weather the volatile markets of 2022 and beyond.
We believe that our quality-first, forward-looking approach to dividend investing may offer a compelling solution for investors who seek attractive and sustainable current income with the potential for future dividend growth going forward.
END NOTES
The Consumer Price Index (CPI) measures the monthly change in prices paid by U.S. consumers. The Bureau of Labor Statistics (BLS) calculates the CPI as a weighted average of prices for a basket of goods and services representative of aggregate U.S. consumer spending. The CPI is one of the most popular measures of inflation and deflation.
Free Cash Flow (FCF) represents the cash a company generates after accounting for cash outflows to support operations and maintain its capital assets. FCF is a measure of profitability that excludes the non-cash expenses of the income statement and includes spending on equipment and assets as well as changes in working capital from the balance sheet.
IMPORTANT INFORMATION
The information provided in this document does not constitute investment advice and no investment decision should be made based on it. Neither the information contained in this document or in any accompanying oral presentation is a recommendation to follow any strategy or allocation. In addition, neither is a recommendation, offer or solicitation to sell or buy any security or to purchase of shares in any fund or establish any separately managed account. It should not be assumed that any investments made by GQG Partners LLC (GQG) in the future will be profitable or will equal the performance of any securities discussed herein. Before making any investment decision, you should seek expert, professional advice, including tax advice, and obtain information regarding the legal, fiscal, regulatory and foreign currency requirements for any investment according to the law of your home country, place of residence or current abode. This document reflects the views of GQG as of a particular time. GQG’s views may change without notice. Any forward-looking statements or forecasts are based on assumptions and actual results may vary. GQG provides this information for informational purposes only. GQG has gathered the information in good faith from sources it believes to be reliable, including its own resources and third parties. However, GQG does not represent or warrant that any information, including, without limitation, any past performance results and any third-party information provided, is accurate, reliable or complete, and it should not be relied upon as such. GQG has not independently verified any information used or presented that is derived from third parties, which is subject to change. Information on holdings, allocations, and other characteristics is for illustrative purposes only and may not be representative of current or future investments or allocations. The information contained in this document is unaudited. It is published for the assistance of recipients, but is not to be relied upon as authoritative and is not to be substituted for the exercise of one’s own judgment. GQG is not required to update the information contained in these materials, unless otherwise required by applicable law. No portion of this document and/or its attachments may be reproduced, quoted or distributed without the prior written consent of GQG. GQG is registered as an investment adviser with the U.S. Securities and Exchange Commission. Please see GQG’s Form ADV Part 2, which is available upon request, for more information about GQG. Any account or fund advised by GQG involves significant risks and is appropriate only for those persons who can bear the economic risk of the complete loss of their investment. There is no assurance that any account or fund will achieve its investment objectives. Accounts and funds are subject to price volatility and the value of a portfolio will change as the prices of investments go up or down. Before investing in a strategy, you should consider the risks of the strategy as well as whether the strategy is appropriate based upon your investment objectives and risk tolerance. Where referenced, the title Partner for an employee of GQG Partners LLC indicates the individual’s leadership status within the organization. While Partners hold equity interests in GQG Partners Inc., as a legal matter they do not hold partnership interests in GQG Partners LLC or GQG Partners Inc. GQG Partners LLC is a wholly owned subsidiary of GQG Partners Inc., a Delaware corporation that is listed on the Australian Securities Exchange.
INFORMATION ABOUT BENCHMARKS
Net total return indices reinvest dividends after the deduction of withholding taxes, using (for international indices) a tax rate applicable to nonresident institutional investors who do not benefit from double taxation treaties. Information about benchmark indices is provided to allow you to compare it to the performance of GQG strategies. Investors often use these well-known and widely recognized indices as one way to gauge the investment performance of an investment manager’s strategy compared to investment sectors that correspond to the strategy. However, GQG’s investment strategies are actively managed and not intended to replicate the performance of the indices: the performance and volatility of GQG’s investment strategies may differ materially from the performance and volatility of their benchmark indices, and their holdings will differ significantly from the securities that comprise the indices. You cannot invest directly in indices, which do not take into account trading commissions and costs.
The S&P 500® Index is a widely used stock market index that can serve as barometer of US stock market performance, particularly with respect to larger capitalization stocks. It is a market-weighted index of stocks of 500 leading companies in leading industries and represents a significant portion of the market value of all stocks publicly traded in the United States.
The Russell 1000 Index is a subset of the Russell 3000 Index that includes approximately 1,000 of the largest companies in the US equity universe. Constructed using a transparent, rules-based methodology, the Russell 1000 Index is designed to provide unbiased representation of the large cap segment of the US equity market.
NOTICE TO AUSTRALIA & NEW ZEALAND INVESTORS
The information in this document is issued and approved by GQG Partners LLC (“GQG”), a limited liability company and authorised representative of GQG Partners (Australia) Pty Ltd, ACN 626 132 572, AFSL number 515673. This information and our services may only be provided to retail and wholesale clients (as defined in section 761G of the Corporations Act 2001 (Cth)) domiciled in Australia. This document contains general information only, does not contain any personal advice and does not take into account any prospective investor’s objectives, financial situation or needs. In New Zealand, any offer of a Fund is limited to ‘wholesale investors’ within the meaning of clause 3(2) of Schedule 1 of the Financial Markets Conduct Act 2013. This information is not intended to be dis-tributed or passed on, directly or indirectly, to any other class of persons in Australia and New Zealand, or to persons outside of Australia and New Zealand.
NOTICE TO CANADIAN INVESTORS
This document has been prepared solely for information purposes and is not an offering memorandum nor any other kind of an offer to buy or sell or a solicitation of an offer to buy or sell any security, instrument or investment product or to participate in any particular trading strategy. It is not intended and should not be taken as any form of advertising, recommendation or investment advice. This information is confidential and for the use of the intended recipients only. The distribution of this document in Canada is restricted to recipients in certain Canadian jurisdictions who are eligible “permitted clients” for purposes of National Instrument 31-103 Registration Requirements, Exemptions and Ongoing Registrant Obligations.
NOTICE TO SOUTH AFRICAN INVESTORS
Investors should take cognisance of the fact that there are risks involved in buying or selling any financial product. Past performance of a financial product is not necessarily indicative of future performance. The value of financial products can increase as well as decrease over time, depending on the value of the underlying securities and market conditions. The investment value of a financial product is not guaranteed and any Illustrations, forecasts or hypothetical data are not guaranteed, these are provided for illustrative purposes only. This document does not constitute a solicitation, invitation or investment recommendation. Prior to selecting a financial product or fund it is recommended that South Africa based investors seek specialised financial, legal and tax advice. GQG PARTNERS LLC is a licensed financial services provider with the Financial Sector Conduct Authority (FSCA) of the Republic of South Africa, with FSP number 48881.
NOTICE TO UNITED KINGDOM INVESTORS
GQG Partners is not an authorised person for the purposes of the Financial Services and Markets Act 2000 of the United Kingdom (“FSMA”) and the distribution of this document in the United Kingdom is restricted by law. Accordingly, this document is provided only for and is directed only at persons in the United Kingdom reasonably believed to be of a kind to whom such promotions may be communicated by a person who is not an authorised person under FSMA pursuant to the FSMA (Financial Promotion) Order 2005 (the “FPO”). Such persons include: (a) persons having professional experience in matters relating to investments; and (b) high net worth bodies corporate, partnerships, unincorporated associations, trusts, etc. falling within Article 49 of the FPO. The services provided by GQG Partners and the investment opportunities described in this document are available only to such persons, and persons of any other description may not rely on the information in it. All, or most, of the rules made under the FSMA for the protection of retail clients will not apply, and compensation under the United Kingdom Financial Services Compensation Scheme will not be available.
GQG Partners (UK) Ltd. is a company registered in England and Wales, registered number 1175684. GQG Partners (UK) Ltd. is an appointed representative of Sapia Partners LLP, which is a firm authorised and regulated by the Financial Conduct Authority (“FCA”) (550103).
© 2023 GQG Partners LLC. All rights reserved.
Data presented as at September 2022 and denominated in US dollars (US$) unless otherwise indicated.
TLFLI DIVINC0922